

Twelve interview accounts bring workplace experiences into the analysis, including contrasting perspectives—not a statistical measure of engagement.
Conceptual illustration · Not research evidence
Explore the evidence →
Two questions connect employees’ perceptions of storytelling with the role of visualization in trust, understanding, and interpretation.
Conceptual illustration · Not research evidence
Explore the evidence →
Six themes organize the interview findings around communication, meaning-making, collaboration, visualization, trust, and technology.
Conceptual illustration · Not research evidence
Explore the evidence →
Thirty codes provide a more detailed view of the patterns beneath the themes, linking the thematic framework back to participant accounts.
Conceptual illustration · Not research evidence
Explore the evidence →The questions
How do frontline employees and managers perceive the role of data storytelling in enhancing employee engagement within supply chain and operational environments?
Participants perceived data storytelling — the addition of context, cause, and consequence to raw operational figures — as associated with increased engagement, while raw or unexplained data was associated with confusion and, in one severe case, costly organizational error. The perception was strongly but not universally shared: P4 described an organizational culture in which storytelling was largely absent.
How does narrative visualization influence employees’ trust, understanding, and interpretation of operational data?
Narrative visualization’s influence depended on the fit between visual form and data structure, the presence of accompanying explanation, and audience-specific tailoring. Transparency about data limitations was the most consistent trust-building practice; its absence — particularly deliberate omission — was the most serious threat to trust. P8’s categorical rejection of visual formats, set against P9’s affirmatively positive account, showed that fit, not frontline status, is what the evidence differentiates.
Workplace challenges
Different environments, everyday pressures
Illustrative workplace scenarios, not findings from the dissertation. The AI-generated scenes are not photographs of the study sites or additional research evidence.
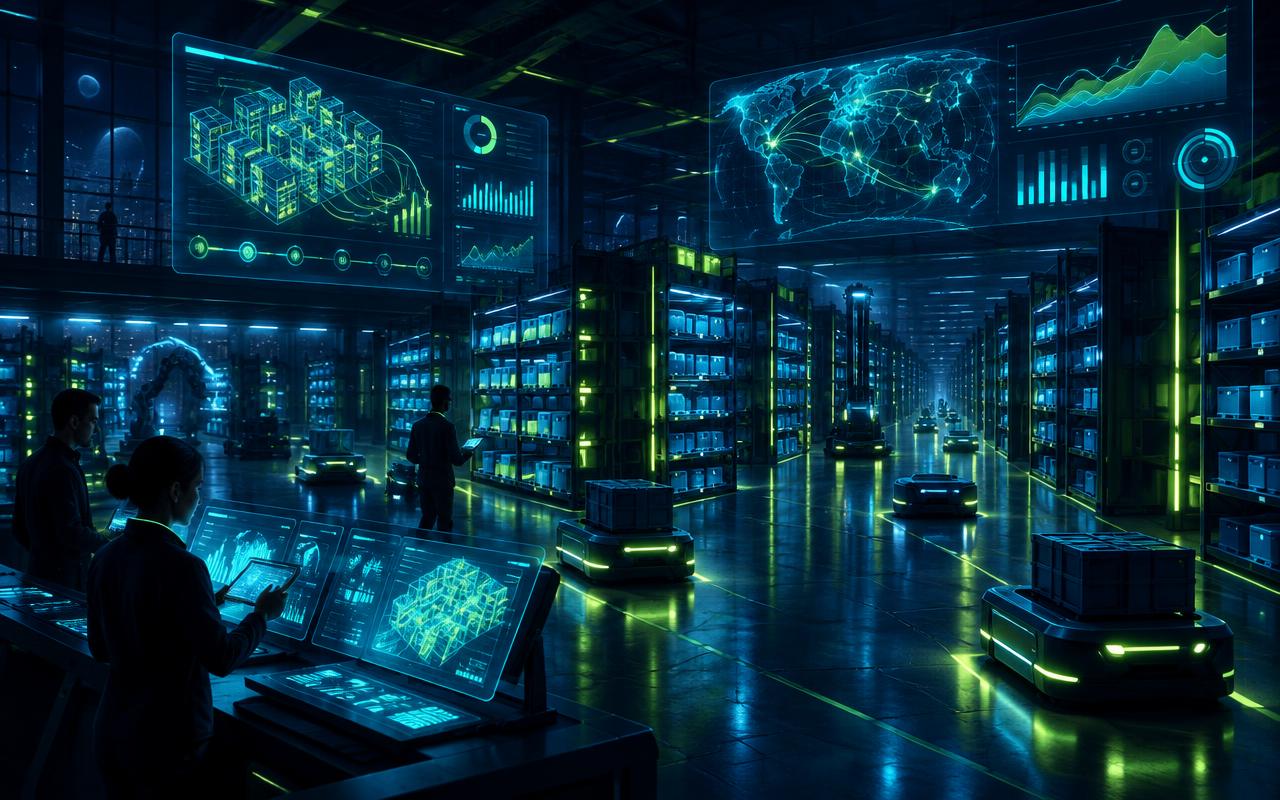
Warehouse · Inventory & shift handovers
A delayed shipment, a stock mismatch, or an incomplete handover can leave teams working with different information. The challenge is knowing what changed, which orders are affected, and who needs to act next.

Executive meeting · Priorities & decisions
Competing targets, incomplete forecasts, and pressure to decide can pull leaders in different directions. The challenge is weighing trade-offs, making uncertainty visible, and explaining how decisions will affect employees.

Factory · Downtime & production pressure
Equipment stoppages, quality alerts, and changing production targets can disrupt a shift. The challenge is understanding the cause, coordinating maintenance and operations, and keeping safety visible alongside output.
Theme 06 · Technology as enabler
AI turns raw data into narrative
Participants described AI as an emerging accelerant for narrative generation — technology that can help turn streams of numbers into narratives. The GENIOS link is a conceptual companion, not an evaluated intervention in this dissertation.
GENIOS — Everyday Impact Stories is a live demo companion to this research. Any generated explanation still needs to be checked against the original data; this study does not establish the demo’s effects on engagement.
Open the GENIOS demo →
Thematic framework
Six themes, thirty codes